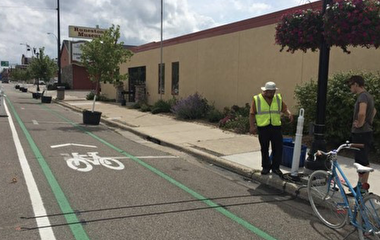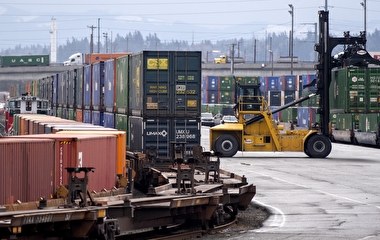
Transportation funding comes from all levels of government: federal, state, and local. While taxes directly generated by local governments stay in those jurisdictions, federal and state transportation funding may be collected in one area and redistributed to others.
U of M researchers are continuing their ongoing study of transportation funding redistribution in Minnesota. Their most recent analysis looked at the six-year period between 2015 and 2020. The work was led by Camila Fonseca, director of fiscal research with the Institute for Urban and Regional Infrastructure Finance (IURIF) at the Humphrey School of Public Affairs, and sponsored under the Transportation Policy and Economic Competitiveness (TPEC) Program. TPEC is a joint program of IURIF and CTS.
Federal transportation revenues include the fuel tax and other special taxes. State transportation revenues include the state fuel tax, motor vehicle registration tax, and motor vehicle sales tax.
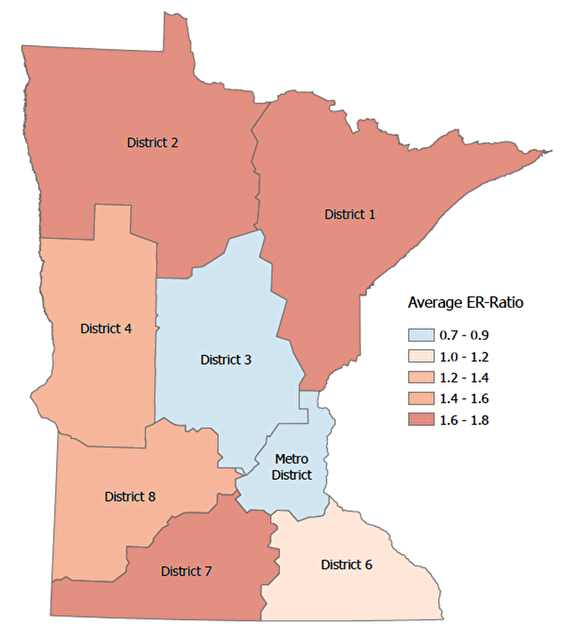
Counties in Minnesota are divided into eight transportation districts. For the analysis, the researchers aggregated or allocated data to the county level using the TPEC Transportation Finance Database. They then presented the aggregated results at the district level for both roadways and transit.
The team found that from 2015 through 2020, the Twin Cities Metro District contributed more than it received: It contributed about 50 percent of federal and state transportation revenues ($2.544 billion) and received about 45 percent back in expenditures ($2.503 billion).

District 3, in the central part of the state, also received less than it contributed. “All other districts received more than they contributed, probably due to much lower population density in these counties,” Fonseca explains.
The average funding per vehicle-mile traveled (VMT) in Minnesota was 8.7 cents; of this amount, 4.4 cents came from federal and state transportation special revenues and 4.3 cents from local contributions. “But the amount spent per VMT was higher in counties with lower population densities and many miles of roads—especially those located in the north: 11 cents in District 1 and 11.2 cents in District 2,” she says.
The team also found that local governments fund a growing proportion of the transportation infrastructure in Minnesota—primarily through the property taxes they collect. (Wheelage taxes and sales taxes are also part of the local contribution in some areas.)
During 2015–2020, federal and state special revenues accounted for about 50.4 percent of total transportation funding in Minnesota, while local efforts accounted for about 49.6 percent. During 2010–2015, local efforts accounted for about 45.5 percent, Fonseca says.
The team’s transit analysis showed that about 55 percent of public transit expenditures in Minnesota came from federal and state special revenues. Fare revenue paid for about 13 percent of expenditures, while other local efforts covered about 32 percent. Overall, Metro District counties received almost 90 percent of total public transit spending in Minnesota.
Other members of the research team were Raihana Zeerak (IURIF research associate), Jerry Zhao (IURIF founder and advisor), and Adeel Lari (IURIF director).


